If you’ve not been living under a rock, you’ve probably already heard about machine learning (ML) technology. After all, on Software Planet’s blog page alone, this topic has already been covered from multiple angles — read about the difference between ML and AI, or how does AI work for example.
But to those of you who are still furrowing your brows, this not only represents the current state of AI today, but it is also how developers can create “intelligent” products, like the Amazon Alexa or Apple’s much-lauded Siri.
Though of course, none of these would be possible without complex ML algorithms, it is the simple linear regression that enables accurate predictions.

Prediction-Making 101
Now this — if you’ve had any contact at all with software developers — you will undoubtedly have come across. In fact, we would go so far as betting that when you did, it simply went over your head like a tiny plane over Heathrow airport.
Yet understanding how linear regression works not only can improve your communication with developers, but will also benefit your company in more ways than you can probably imagine.
So let’s dive right in!
Step 1: Procure the right data
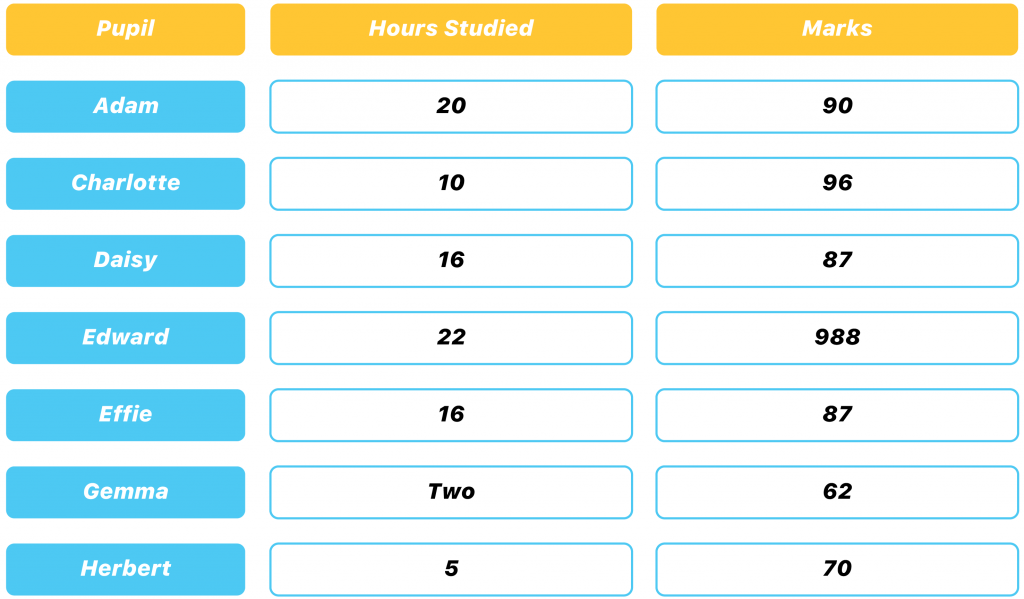
Suppose, for instance, that you are trying to determine whether or not your son’s marks will improve should he set out to study significantly harder. In this case, you would need to gather data regarding the number of hours studied, the marks your child achieved, and the same for other students that you could hopefully obtain from their teacher.
Step 2: Ensure consistency
This would lead to a simple table that would allow you to view the data from a wholly unbiased, catch-all perspective. Your son’s name is Herbert, by the way — don’t blame us, though, you named him!
As you could probably tell from the table above, the data we obtain from our sources may not always be entirely consistent. Here, for instance, Herbert’s teacher wrote “two” instead of using the appropriate number, and that “988” that Edward scored looks suspiciously like a typo.
This is when assumptions must inevitably come into play. Thus, in the present case, we will have to assume that when the teacher typed 988, she actually intended to type 98. Yes, of course, this may or may not be true, but it is certainly a plausible assumption.
Step 3: Exploratory Data Analysis
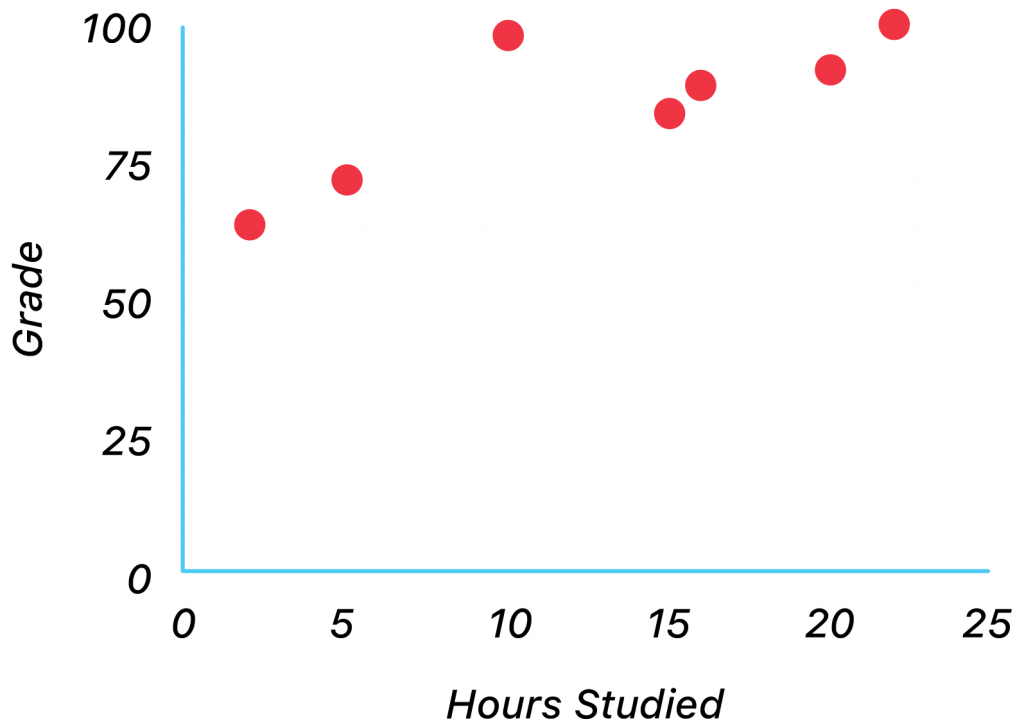
Next, we perform what is known as exploratory data analysis, or EDA for short. This allows us to find out if there is a positive or negative correlation between our variables, and also to identify which outliers may potentially be present. We can easily do this by taking the information we used for our table and converting it completely into a simple scatter plot.
As expected, the graph shows us that there is indeed a positive correlation between the hours that were studied and the marks that the pupils received. The other notable piece of insight, however, is that Charlotte is one clever cookie, as she did amazingly well despite studying for just 10 hours.
She is, of course, the outlier that was mentioned above.
Step 4: Find the equation
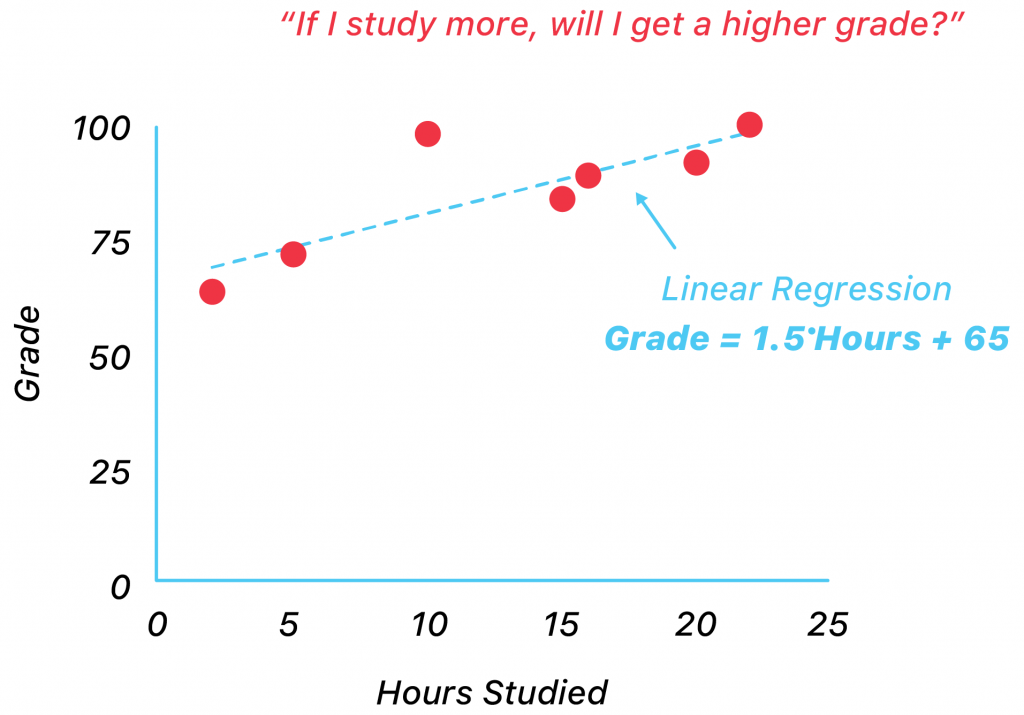
Lastly, by fitting a line to our graph and using y=mx+c, we can discover the final equation for the relationship between our variables. As you can see in the image below, the marks will equal 1.5*Hours + 65.
Do keep in mind, however, that because little Charlotte is so rudely tampering with our results, even if we predicted a perfect 100 for the ill-named Herbert, the actual outcome should be slightly inferior.
You Can Use It for Virtually Anything!
So that’s a wrap! Now that you know how SPG use linear regression, you can take it onboard yourself and apply it to a variety of issues.
The machine learning algorithm can be used, for instance, to predict the sales of products based on past consumer behaviour; to discover how much to pay employees based on years of previous experience; to help you achieve the best price to sales ratio and become extremely competitive, and even to learn where to move your HQ and enjoy the cheapest rent in town.
So what are you waiting for? Apply linear regression to your field of choice today and let us know how your company get on!


