While pertinent price charts are the cornerstone of any trading platform worth its salt, until recently, providing users with a bespoke trading terminal was only reserved for a selected few. After all, beyond the expenses and niche expertise, these are also extremely complex applications. Thankfully, however, not only is it more than possible for stock brokers to quickly develop a bespoke trading solution, but as we hope to show in today’s article, you can also build a trading terminal with a panoply of responsive charts.
At a Glance
What Users Expect from a Modern Trading Terminal
3. Usability and user-friendliness
Why Most Software Providers Are Unable to Build a Custom Trading Platform
1. Lack of financial expertise
2. The complexity of data visualisation
How to Build a Trading Terminal Today
Software Planet Group’s Trading Terminal Core In Action
Everything You Can Do With Software Planet Group’s Trading Terminal Core
What Users Expect from a Modern Trading Terminal
Whether creating a trading platform from scratch or identifying a suitable existing solution, you will have to provide your customers with a trading terminal of your choice. Of course, deciding on an appropriate terminal is hardly ever a straightforward matter, as there are 2 main varieties of trading terminals: applications that are built exclusively for particular brokers and independent terminals which may be licensed to any interested stock broker. It is also worth pointing out, however, that some owners of independent terminals do not provide their products to interested brokers.
So with all of this in mind, you will have to make the choice that’s right for your company, either to build your own trading terminal — which can sometimes be terrifying — or to license an existing platform. In either case, let’s examine what the user expects from a modern broker terminal:
1. Visualisation options
Price visualisation charts are a non-negotiable component of trading terminals, as customers expect all kinds of options — from candlestick charts, to bar charts, to live view, horizontal volume and clusters.
2. Trading options
The core components of any trading terminal are the abilities to execute trades, make use of different types of orders and display indicators and trading statistics.
3. Usability and user-friendliness
The next thing that every user expects is usability when working with terminals. That is, it should be easy to zoom in and out of charts, intuitively move from a chart to another, smoothly scroll through the visual area, etc. Note that the more data you are currently displaying, the harder this will be to achieve in practice.
4. Customisation options
Users should also have the ability to change parameters for virtually everything they can see on the screen. For instance, they should be able to easily access Chart Settings that will enable them to select different colours, modify line thickness at will and even fully customise axis scales if improving chart readability is needed.
5. Multiple indicators
Beyond the indicators that are shown by default, your clients will also wish to have the ability to add their own preferred indicators to the chart and use measurement tools including Fibonacci lines, horizontal volume area and others. Ideally, they should also be able to mix different indicators within a single designated view area and move them freely to an isolated part of the screen, as this will allow them to study price movements from a series of selected angles.
6. Annotations
Finally, users will also expect to be given the option to study price movements with their own annotations. This means that it should be easy to draw trend lines, trend channels and write memos whenever they please, as this will enable them to explore their options and plan their next move with greater confidence.
Why Most Software Providers Are Unable to Build a Custom Trading Platform
Another important feature of any trading platform is the financial instruments it supports. These will often consist of stocks, futures, options, bonds, currencies or any combination of the above. As a result, while some terminals present advanced tools for option traders, for instance, these may be entirely useless for stock traders, for example.
The ensuing complexity often means that though every broker dreams of having their own trading terminal, for a majority of them, this is simply unachievable. This is due to a variety of different factors:
1. Lack of financial expertise
Most developers have little to no experience with trading software, which means you cannot simply request a platform and expect it to be promptly delivered, as it takes time to grasp the ins and outs of the market, including simple things like knowing the difference between stocks and futures.
2. The complexity of data visualisation
By and large, developers utilise third-party charts, as it’s a lot more convenient to make use of pre-built components than to somehow attempt to reinvent the wheel. Unfortunately, however, the industry suffers from a lack of quality ready-made components. So while you can certainly still rely on the TradingView chart component in your software, for instance, you would also have to obtain a licence and would be unable to modify it at will.
3. The web vs desktop issue
The age-old question when it comes to trading terminals is whether to build it for the desktop or the web. This is because both options come with their own advantages as well as significant development drawbacks. If you would like to develop a trading platform for the web, for example, this is actually far from straightforward, as you are dealing with vast amounts of data which not all browsers will be optimised to handle. Similarly, although if you are looking to build a desktop trading platform, you will in theory be able to build a more powerful solution, you will also have to take extra (read: expensive) steps to ensure cross-compatibility with Windows, Linux and macOS.
How to Build a Trading Terminal Today
Thankfully, your dream of building your own trading terminal might be closer to reality than you think. As mentioned at the start of this article, relevant charts are the core component of every trading terminal worth its salt, and this is where Software Planet Group are able to help. In fact, we have already developed the core solution that can be built upon to create your trading software!
Notably, you can include as many charts and indicators as you like, as our software can snappily handle not years but decades’ worth of accumulated data.
Even better, unlike other terminals, which require JRE or the .NET Framework to run alongside your application, we build our charts using the zero dependencies Go language. This means that we can build trading solutions natively and with a negligible memory footprint to boot — so tiny, in fact, that you can even send the app over an email! In addition, you can launch your trading terminal on any platform, be it desktop, mobile or web.
Software Planet Group’s Trading Terminal Core In Action
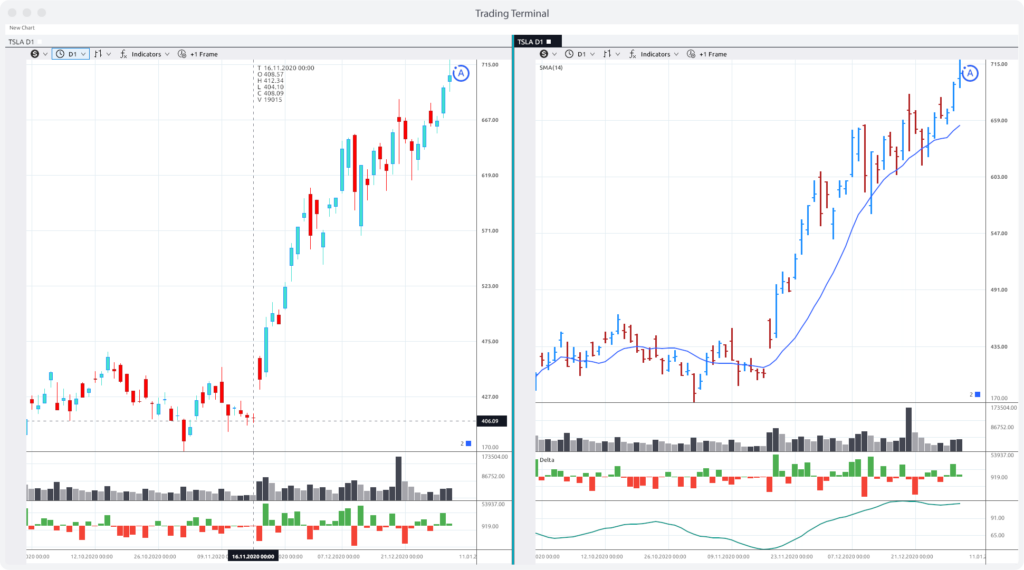
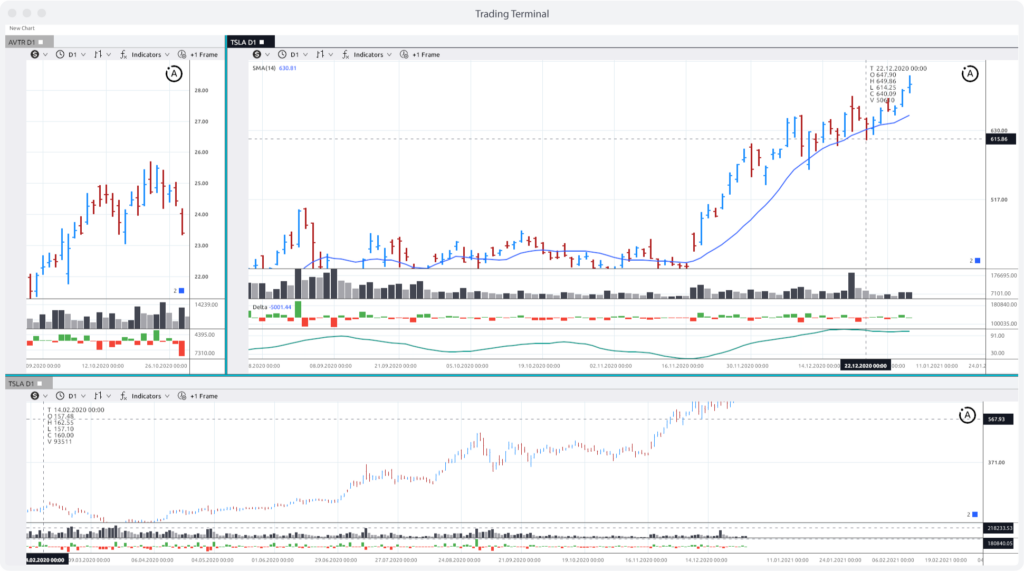
The following screenshots show our trading terminal core in action, so you can understand exactly what we mean:
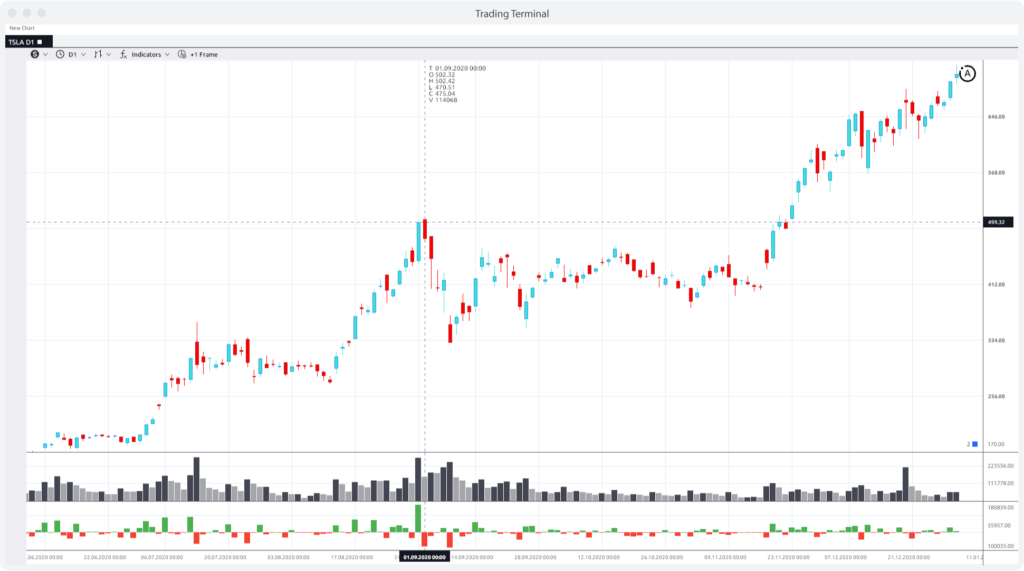
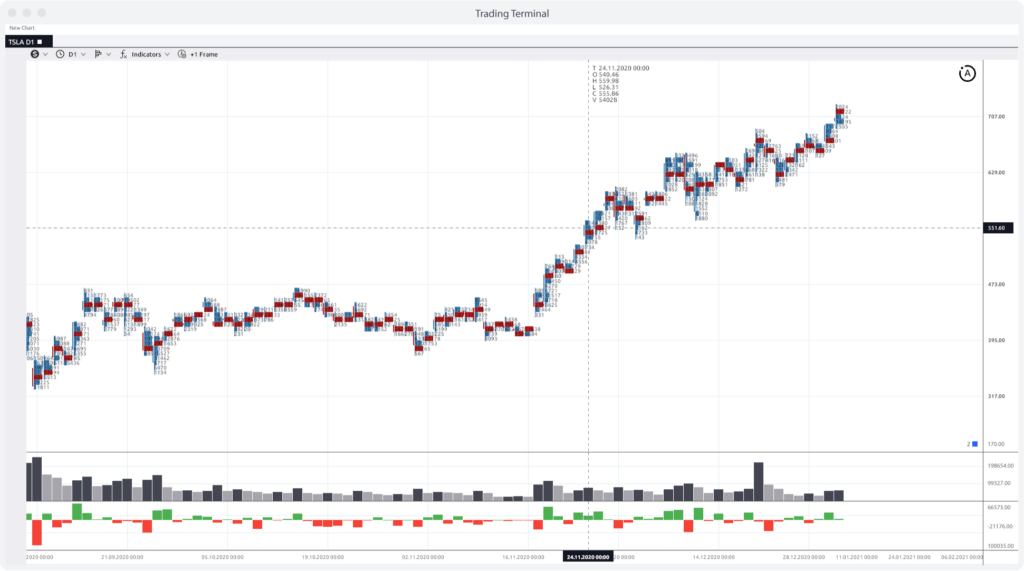
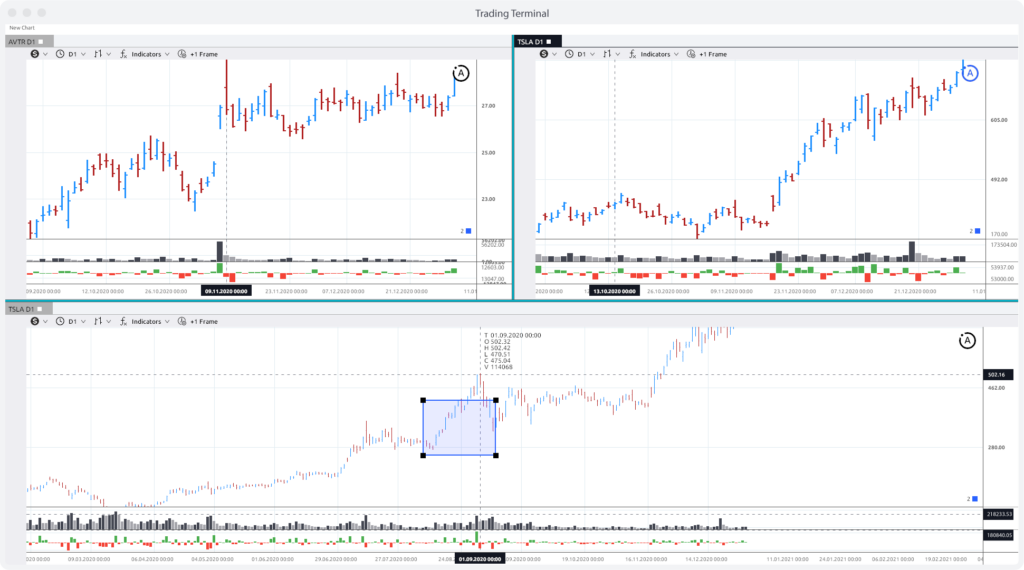
As you can see, we have a very flexible layout system, so you can easily create new charts and divide your workspace however you please. If you have multiple monitors in your office, for instance, you can even view a different chart on every screen!
So long as you’re a licensed broker, we can help your customers analyse price movements on any stock exchange of your choice. Keep in mind, however, that our bespoke solutions are not limited to a single market and can be used to support cryptocurrencies, leveraged tokens, futures and virtually any other instrument out there!
Everything You Can Do With Software Planet Group’s Trading Terminal Core
With the below features readily available, we can quickly build the trading terminal that’s the perfect fit for your company:
- Implement integration with different broker APIs
- Use tick data or frame data as a source
- Employ multiple real-time and historical charts
- Rearrange windows on the screen and manage their sizes using drag & drop features
- Group charts by a particular symbol (changing a symbol inside linked windows will change the symbol within dependent charts)
- Use predefined and custom time frames
- Use different price visualisation methods (e.g. bars, line, area, candlesticks and clusters)
- Have multiple areas within each chart
- Use the data from one indicator as a source for another
- Use multiple indicators within an area of the chart
- Use different timeframes and tick data for each indicator on a chart
- Use drawing tools within a chart (e.g. trend lines, rectangle areas, horizontal volumes, etc.)
- See price clusters on the chart such as Bid, Ask volume, Delta, POC, VAH and VAL areas
- Customise the grid including X & Y scales.
Whether you are looking to develop a trading terminal from scratch or integrate our charts into an existing trading solution, our experienced Agile developers are more than happy to be of assistance!
Integrating AI in Bespoke Trading Terminals
Leveraging modern AI capabilities can significantly enhance bespoke trading terminals. AI algorithms can analyse vast amounts of market data in real time, providing predictive analytics and identifying trading opportunities. Machine learning models can learn from historical data to improve trading strategies, while natural language processing (NLP) can interpret market news and sentiment analysis. AI can also automate trading processes, reducing human error and increasing efficiency. Integrating AI-driven chatbots offers users personalised support and real-time updates. These advanced capabilities can transform trading terminals into powerful, intelligent platforms.